There are so many variables that control well recovery—total proppant, total fluid, perforated length, wellbore length, reservoir geology—that it’s common for internal and external company analysts to use production from the peak month (month with highest production) as a quick a proxy for producible reserves.
Be warned, however, that while the relationship is true in a gross sense—the better the peak oil number, the better the chances of good to excellent producible reserves—there are enough excursions from the relationship to urge analysts to use caution in making this assumption.
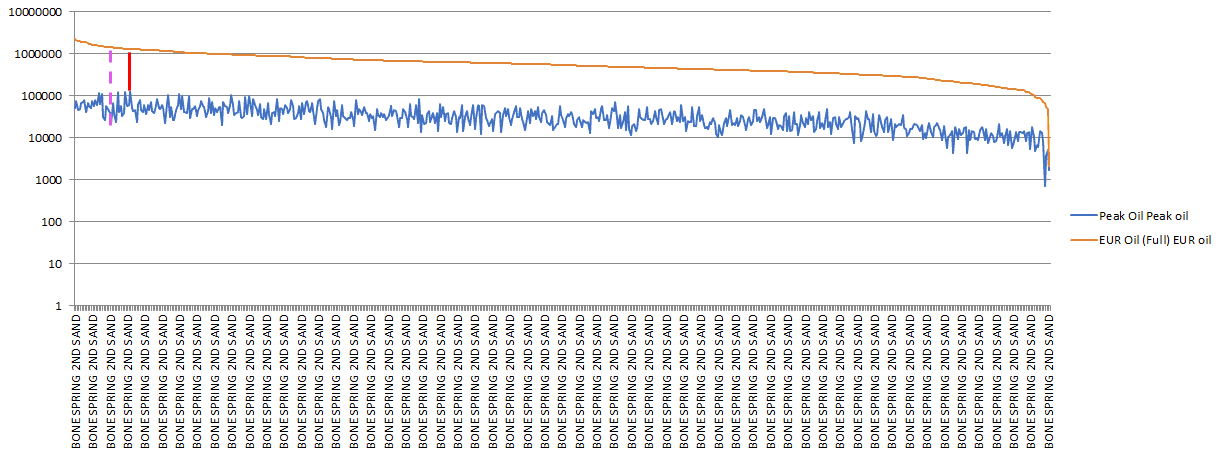
The peak oil and estimated ultimate recovery (EUR) trend for the Bone Spring Second Sand are illustrated in the graph below.

The general correlation between excellent peak oil and excellent EUR is apparent.
But focus on the area where the dashed pink line and solid red line are drawn on the graph.
The dashed pink line has a peak oil value of 21,171 barrels of oil per month (BOPM), or about 700 barrels of oil per day (BOPD). Its EUR is slightly more than 1,500,000 barrels.
The red line pinpoints a well with an excellent peak oil value of 124,636 BOPM (about 4,000 BOPD), but its EUR is predicted to be about 1,400,000. Farther down the data display there’s a point with a peak oil value of 82,940 BOPM (about 2,800 BOPD) with a diminished EUR of 660,000 barrels of oil.
The map below shows these three example wells, sized by EUR oil (full), rendered within a total organic carbon (TOC) map. The peak oil values of the wells with the high EUR numbers differ by more than 100,000 BOPM, yet they are predicted to deliver nearly the same level of reserves.
The following graphic, with more Bone Spring Second Sand wells displayed, provides a better sense of the peak oil variation.
A quick look at a part of the Eagle Ford oil window shows a similar lack of uniform correlation between peak and EUR oil.
The graph below shows the variability in the top 30 peak oil wells in the sample.
Gas provinces are not nearly as subject to the kind of variation between peak rates and EUR.
The composite map below from Enverus Drillinginfo’s Play Assessments compares Marcellus peak gas and EUR (full). The areas of high peak month gas production are generally consistent with areas of high EUR.
However, not all gas plays behave the same way; the maps below indicate that peak gas may not be a straightforward predictor of EUR in the Haynesville/Bossier play.
So, it’s good to exercise caution when using peak oil or peak gas as quick proxy for the potential return on investment on an unconventional well. Spacing and parent-child interference can yield wildly different results, even within areas of similar geology.
If you’ve used peak oil and peak gas analysis in this way, please share your stories or thoughts with me at [email protected].
