Recent commentaries on the magic of the Permian miracle have had some dark musings about how the Permian is beginning to “stall.”
Given all the back and forth in the investment community about “capital discipline” and output growing supply to the detriment of pricing, I thought I’d take a brief look at Estimated Ultimate Recovery (EUR) growth in the Delaware Basin to read the tea leaves.
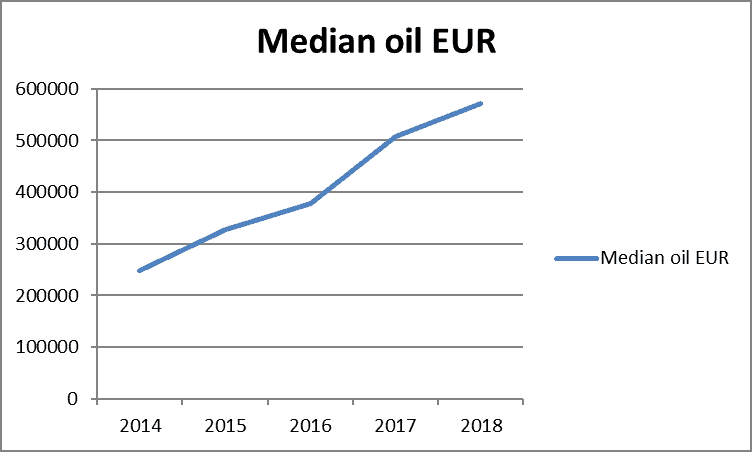
On a very gross level, median oil EUR across all reservoirs has improved year-over-year as shown below (EUR binned by year of first production, EUR data from Wellcast).

A look at all wells identified by landing zones, with enough months of production to support reasonable EUR calculations over time, looks like this:
The trend is pretty clear—by and large, well EURs have improved over time, although it looks as over the past 12-18 months the uptrend in improvements has moderated. This is probably due to downspacing and the potentially negative effects of parent-child well interference.
Note however, that starting in early 2016 the number of wells that significantly outperformed the median values increased (outlined in red above). This “breakout” of superior performance may be a harbinger of better returns to come—unless the cumulative production values are actually stacked well reporting.
The distribution of wells binned by EUR greater than 500,000 and 1 million Bbl shows year-over-year improvement, but with less acceleration year-over-year for 2017-2018.
If we look at a graph of EUR distributions by reservoir, we get what you see below:
This shows that for the landing zone assignments in Wellcast (Bone Spring Second Sand, etc.) there are relatively smooth distributions of EUR values for all mapped reservoirs, although some reservoirs have been preferentially targeted by operators. For example, the Wolfcamp A Lower has been the most preferred drilling target.
The story of improving EURs over time is generally true at the reservoir level.
Graphing sample size, number, and percentage of wells with greater than 500,000 BO EUR and greater than 1 million BO EUR, it’s clear that some reservoirs deserve the higher drilling densities they’ve seen. The percentage of wells with EURs greater than 500,000 Bbl or even 1 million Bbl is significant. The Wolfcamp Lower A saw 54% of wells with oil EURs of 500,000 Bbls or better, and 15% of well with oil EUR of 1 million Bbl or more.
We can focus on the Bone Spring Second Sand and the Wolfcamp A Lower for a bit of added insight.
Over time, Bone Spring Second Sand EURs have steadily improved, although moving into 2019 there’s a hint of a drop off.
As might be expected, early engineering practices improved over time to deliver growing EUR valuations. Starting around the end of 2016 into early 2017 we began to see wells with exceptional outlier EUR values (circled in pink).
We see the same behavior in the Wolfcamp A Lower.
I attempted to see if there was a generic explanation for the exceptional EUR outliers hidden within the engineering data—lateral length vs. total proppant vs. total fluid, etc.
Both the Bone Spring Second Sand and Wolfcamp A Lower show year-over-year increases in the lateral length drilled, the amount of proppant, and the amount of fluid deployed in completions.
Bone Spring Second Sand EUR as a function of lateral length shows that two lengths—5,500 to 7,000 feet and 8,500 to 9,500 feet, are likely to limit the number of wells with EUR values greater than 700,000 Bbl. However, there’s clear trend toward higher EUR with increased lateral length.
Wolfcamp A Lower EURs also show an increase of EUR with lateral length, but the trend is more subdued, with excellent “outlier” EUR values (2 MMBBL or higher) occurring over the range of 6,000 to 10,000 feet. Laterals longer than 13,000 feet generally yield EUR values that are closer to the median reservoir value.
There’s clearly a positive correlation for increased EUR with both total proppant and total fluid in the Bone Spring Second Sand.
However, there is less of a correlation between total proppant and EUR for the Wolfcamp A Lower.
This is probably best explained by stratigraphy—the Bone Spring Second Sand is encased between two carbonate benches that inhibit frac jobs from exiting the Bone Spring Second Sand. This concentrates all the frac job power within the target.
The Wolfcamp A Lower is more than 500 feet thick, is interbedded, and is not bounded by focusing carbonate benches above it and below it, meaning frac jobs are a bit more likely to disperse their energy away from the target being drilled.
Until the spacing “secret sauce” is better understood, accounting for offset interference and variables in engineering and completion practices (and hopefully, geology) to define variables with better than .6r correlation coefficients with EUR will be a challenge.
However, given the steady increase of EUR values—both basin-wide and by reservoir, as well as hints that exceptional outlier values may become the next EUR “norm,” it’s premature to claim that Permian output is declining.
Have a perspective on EUR values?
Please send me a message at [email protected].
(Note: EUR data and landing zone play identification names were obtained from the Enverus Drillinginfo Wellcast product. Only wells with six months or more of production history were included in the analysis.)
