Compare your pricing on goods & services to price indices by basin to build a data-driven strategic sourcing strategy.
Your current price strategy influences revenue in the future. Enverus Market Price Indices provide visibility into the impact of price changes on goods and services, like OCTG, frac chemicals and proppant, by region to find opportunities for balanced, sustainable cost savings.
Basin Name | Proppant | Chemical | Drilling Mud | OCTG | Cement | Day Rate | Mobilization | TOTAL |
|---|---|---|---|---|---|---|---|---|
TOTAL | 27 | 71 | 8 | 40 | 8 | 8 | 8 | 170 |
Anadarko | 3 | 8 | 1 | 5 | 1 | 1 | 1 | 20 |
Appalachian | 3 | 8 | 1 | 5 | 1 | 1 | 1 | 20 |
Ark-La-Tx | 3 | 8 | 1 | 5 | 1 | 1 | 1 | 20 |
Denver | 3 | 8 | 1 | 5 | 1 | 1 | 1 | 20 |
Julesburg | 3 | 8 | 1 | 5 | 1 | 1 | 1 | 20 |
Gulf Coast | 3 | 8 | 1 | 5 | 1 | 1 | 1 | 20 |
Permian | 3 | 8 | 1 | 5 | 1 | 1 | 1 | 20 |
Whole US | 3 | 8 | 1 | 5 | 1 | 1 | 1 | 20 |
Canada | 3 | 7 | 0 | 0 | 0 | 0 | 0 | 10 |
Indices are available at category, sub-category and basin level granularity.
Only Enverus can combine anonymized analytics grade spend data with energy market activity metrics, providing the most accurate, current price trends.
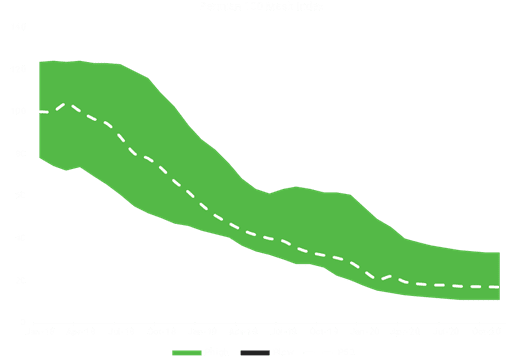
Proppant is getting universally cheaper and has been a big driver for cost reduction over time. Looking at the proppant pricing indices of these two high activity basins, you notice the Permian price index declines much more and ends much lower than the Appalachian index. The Permian also shows more price variation than the Appalachian Basin.
Discover
About Enverus
Resources
Follow Us
© Copyright 2025 All data and information are provided “as is”.