Understanding U.S. and Global Energy Oil Exports and Imports

Join Kpler’s Head Analyst Matt Smith as he dives into the key insights into international crude oil exports and imports in China, Saudi Arabia, Libya, Nigeria and the United States. Understand why a new partnership forged between Enverus and Kpler will provide you with the solutions you need to identify key global market anomalies, fast.

Research written by:  

Matt Smith, Head Analyst, Kpler

Wendi Orlando, VP of Product Management, Enverus

ebook-laptop-hero-image

Partnership Announced Between Enverus and Kpler

Enverus and Kpler have announced a partnership to directly confront global transparency and data challenges in the energy and commodity markets. Addressing issues including data opacity, trend awareness and inventory dynamics, our collaboration aims to sharpen strategic decision-making and market response capabilities.

Tailored Analytical Tools:

Revolutionizing the approach to energy commodity trading, our first joint suite of tools is designed to deliver both macro insights for long-term strategy and real-time data for daily trading decisions:

  • Snapshots: Offers a unified view of trade flows and inventory levels, key for strategic planning.
  • Trade Flow Query: Allows analysts to deeply explore specific market dynamics or commodity flows.
  • Trade Flows Dashboard: Provides traders with daily data updates crucial for timely and informed trades.
figure-1-creating-intelligent-connections-across-commodities
Figure 1 | Creating Intelligence Connections Across Commodities Markets

Source | Webinar: Aligning supply and demand with the current market outlook for pricing: opportunities and challenges
Learn more about how our partnership can help you, visit our dedicated partner page or watch our first joint webinar!

International Crude Oil Exports

Analyzing Trends in Saudi Arabia's Crude Exports

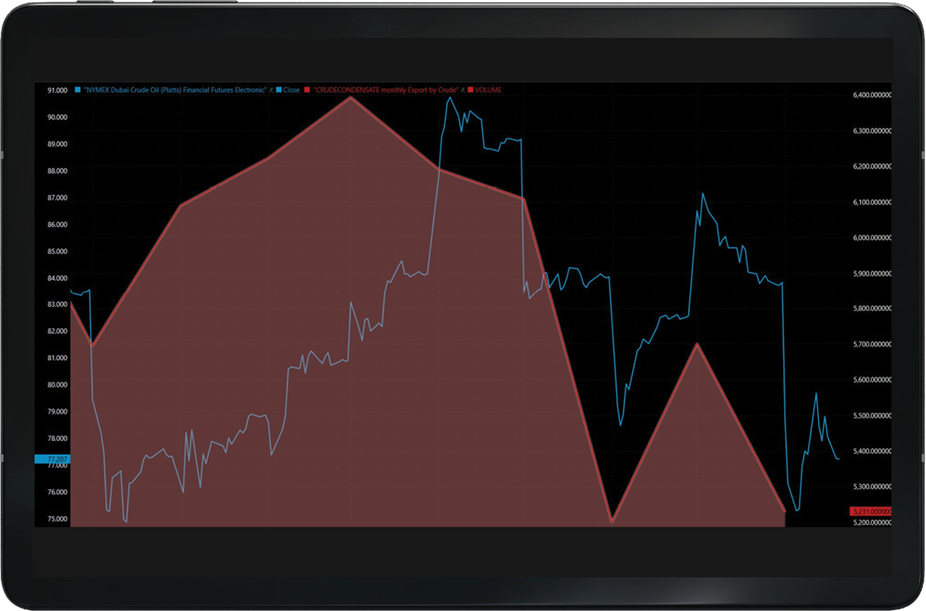
Saudi Arabia, the world’s leading oil exporter, saw its crude exports peak in April 2023 ahead of production cuts, bottoming out in June—a trend partially driven by higher domestic oil consumption during the hotter months. Comprehensive analysis of inventory levels, product exports and refinery operations confirms that the kingdom is adhering to production cuts, consistently operating at around 9 million barrels per day in recent months. Contrary to market expectations, this decrease in exports has not led to a rise in oil prices; both exports and prices have simultaneously trended downwards, as our data with price overlays reveals. This suggests a complex interplay of factors influencing global oil markets, beyond simple supply dynamics.
figure-2-saudi-arabia-monthly-exports-by-total-and-price
Figure 2 | Saudi Arabia monthly exports (condensate, crude oil) by total and price (last two years)
Source | Kpler Trade Flow Data on Enverus MarketView®

China's Influence on Global Crude Oil Markets

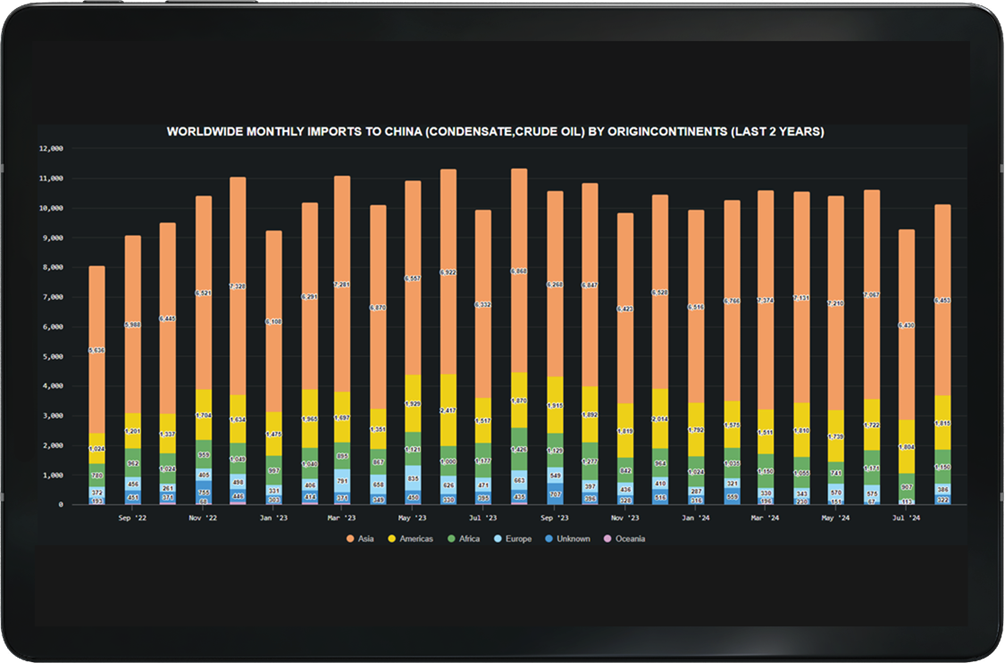
China, the globe’s top crude oil importer typically averaging above 10 million barrels per day, witnessed a notable decrease in imports to 9.3 million barrels last month, marking the lowest level since the start of 2023. This downturn is pivotal for understanding shifts in global crude market trends, especially impacting Saudi Arabian exports—not from production cuts, but due to a dip in Chinese demand. Furthermore, a marked fall in China’s imports from Europe and Africa was observed, largely attributed to the widening Brent-Dubai crude price differential, rendering North Sea and West African imports less economically viable. On the geopolitical front, sanctioned nations including Iran, Venezuela, and Russia contribute roughly 30% to China’s crude intake, with satellite data tracking Iranian shipments underscoring the complex interplay between geopolitics and energy market dynamics.
figure-3-worldwide-monthly-imports-to-china-by-origin-continents
Figure 3 | Worldwide monthly imports to China (condensate, crude oil) by origin continents (last two years)
Source | Kpler Trade Flow Data on Enverus MarketView®

Libya Monthly Exports Crude Oil

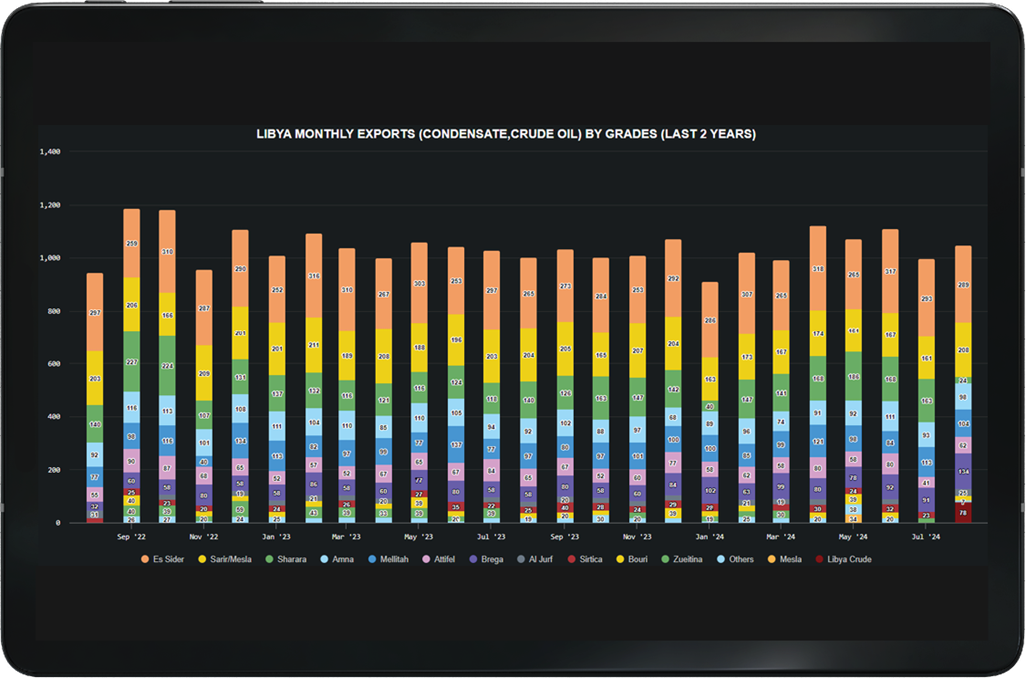
Recent shifts in Libya’s oil production have directly influenced its export metrics, highlighting the agility of data in reflecting real-time market movements. A notable interruption was observed at the start of the month due to the shutdown of El Sharara, Libya’s largest oil field, which typically has output of around 250,000 barrels per day. This closure resulted in a notable drop in Sharara crude grade exports from Zawiya port. Despite initial expectations, the market did not react bullishly, thanks to elevated exports of alternative crude grades that balanced out the shortfall. The swift resumption of exports upon El Sharara’s operational restart underscores the precision of current data in monitoring the pulse of Libyan oil export activities.
figure-4-libya-monthly-exports-by-grade
Figure 4 | Libya monthly exports (condensate, crude oil) by grades (last two years)
Source | Kpler Trade Flow Data on Enverus MarketView®

Nigeria's Dangote Refinery: Reshaping the Atlantic Basin's Supply Dynamics

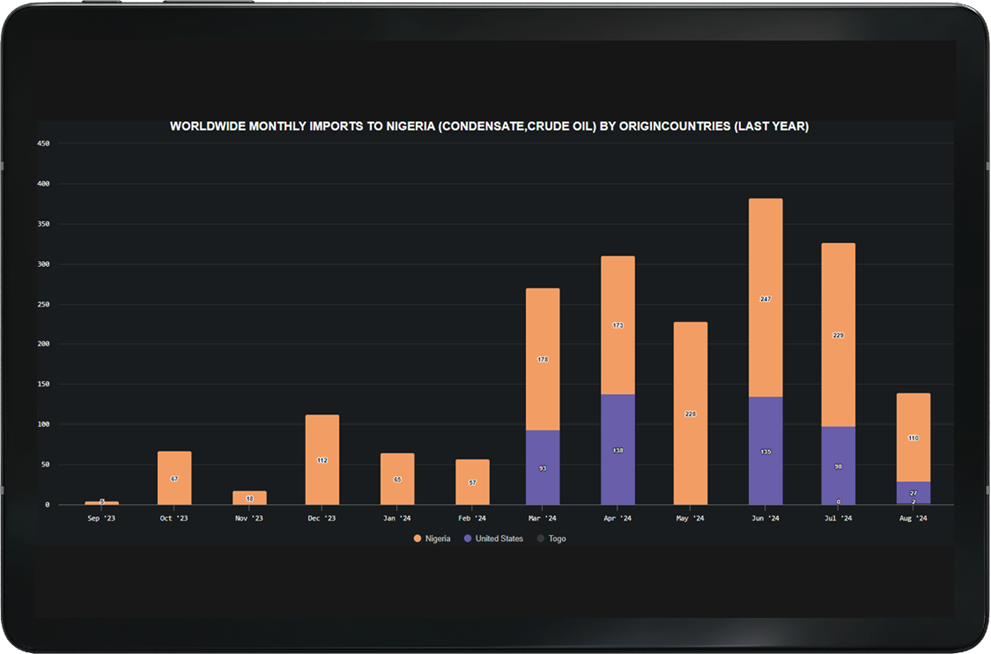
Through the detailed analysis of various data metrics like crude inventory levels, imports, and diverse product exports, we are crafting a comprehensive narrative around Nigeria’s oil market, with a spotlight on the Dangote Refinery. Despite its 650,000 barrels per day capacity, the refinery—owned by Africa’s wealthiest, Mr. Dangote—is currently ramping up, at a pace of 300,000 barrels daily, refining Nigerian and U.S. crudes delivered by sea. The trade flows linked to the refinery’s operations are significantly influencing global crude dynamics, as U.S. crude oil heads to Latin America, Europe, Asia – and now West Africa. Analyzing exports ranging from jet fuel to gasoil, diesel, and fuel oil gives us a window into the refinery’s efficiency and wider impact on West Africa. As Dangote Refinery scales up, it promises to alter the supply landscape of the Atlantic basin, decreasing Nigeria’s import dependency for gasoline and diesel and heralding a major transformation in the regional energy sphere.
figure-5-worldwide-monthly-imports-to-nigeria-by-origin-countries
Figure 5 | Worldwide monthly imports to Nigeria (condensate, crude oil) by origin countries (last year)
Source | Kpler Trade Flow Data on Enverus MarketView®

United States

U.S. Diesel Exports: Adapting to New Market Dynamics

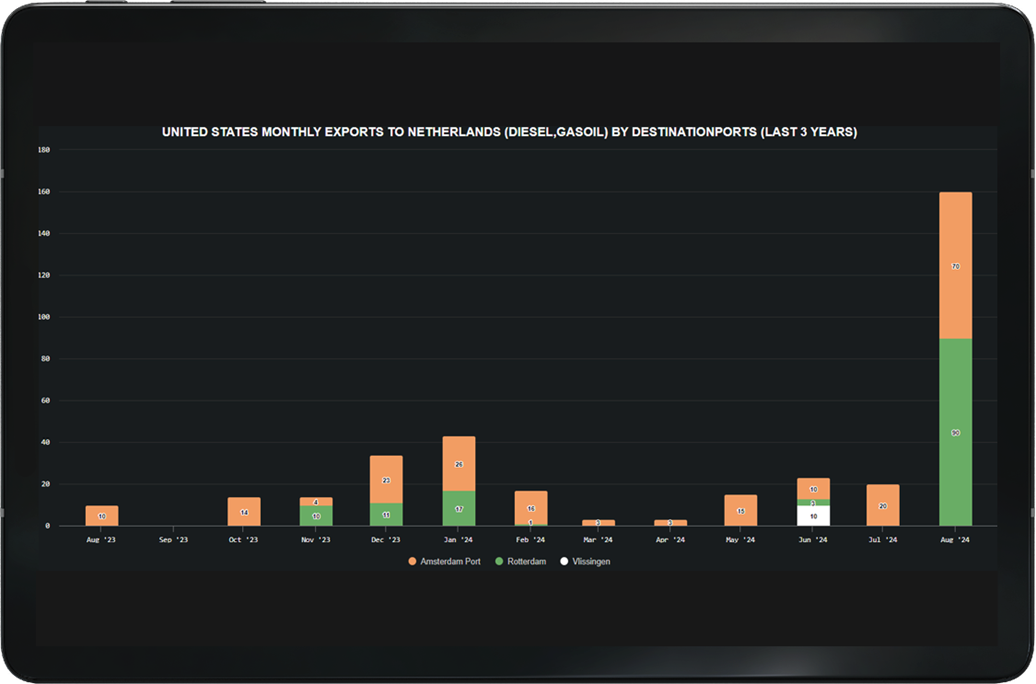
The current landscape of U.S. diesel exports has seen a noticeable pivot, particularly towards the Netherlands, in the wake of recent geopolitical turbulence and sanctions levied against Russia. With Russian diesel rerouted from its usual European destinations to markets like Brazil, the U.S. faces increased competition. Yet, this situation has ushered in new opportunities for Europe to diversify its diesel imports, leading to a surge in U.S. diesel shipments to the Netherlands, reminiscent of an energy-focused game of “musical chairs.” Notably, this uptick, captured 22 days into the month, could signal refinery maintenance influences. A granular port-by-port analysis uncovers an even spread of diesel traffic to Amsterdam and Rotterdam, demonstrating the strategic insights gleaned from close examination of individual terminals and ports.
figure-6-united-states-monthly-exports-to-netherlands-by-destination-ports
Figure 6 | United States monthly exports to Netherlands (diesel, gasoil) by destination ports (last three years)
Source | Kpler Trade Flow Data on Enverus MarketView®

Navigating Weekly U.S. Crude Export Trends

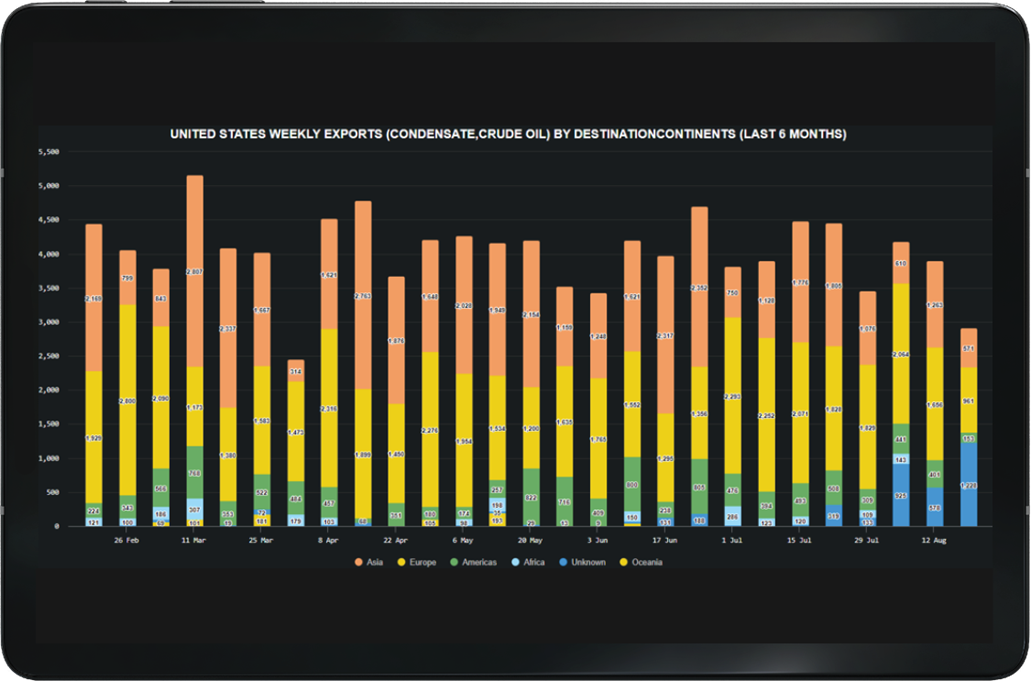
Examining the nuances of weekly U.S. crude exports, they tend to average close to 4 million barrels per day but fluctuate noticeably from week to week. A key observation is the balanced distribution of exports to Europe and Asian markets, although there has been a significant dip in shipments directed towards Asia, especially China, this year. Traders keenly await the weekly Energy Information Administration report, released every Wednesday at 9:30 a.m. CT, a pivotal report that offers insights into export figures, refinery operations, U.S. crude production and Canadian imports. Using the proprietary data of Kpler and Enverus provides a robust framework for forecasting future inventory levels, demonstrating the value of integrating varied data points in market predictions. With this, we wrap our 10-minute segment, highlighting the strategic application of data in navigating market dynamics.
figure-7-united-states-weekly-exports-by-destination-continents
Figure 7 | United States weekly exports (condensate, crude oil) by destination continents (last six months)
Source | Kpler Trade Flow Data on Enverus MarketView®

Let’s get started!

We’ll follow up right away to show you a quick product tour.

Let’s get started!

We’ll follow up right away to show you a quick product tour.

Register Today

Sign Up

Power Your Insights

Connect with an Expert

Access Product Tour

Speak to an Expert