[contextly_auto_sidebar]
Natural gas storage inventories increased 43 Bcf for the week ending April 17, according to the EIA’s weekly report. This was slightly below the expected injection of 45 Bcf.
Working gas storage inventories now sit at 2.140 Tcf, which is 827 Bcf above inventories from the same time last year and 364 Bcf above the five-year average.
Prior to the storage report’s release, the May 2020 contract was trading at $1.895/MMBtu, roughly $0.044 below yesterday’s close. After the release of the report and at the time of writing, the May 2020 contract was trading higher, reaching $1.925/MMBtu.
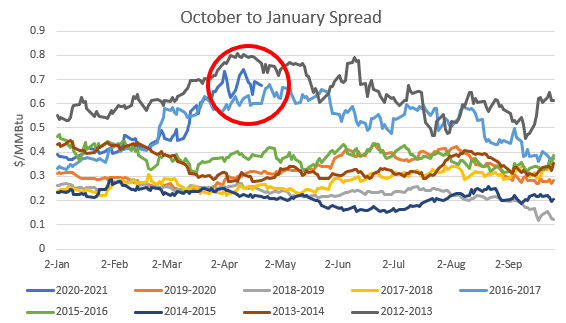
While natural gas prices are currently struggling to find traction to get above $2/MMBtu, the market is pricing an expected shortage of supply come the winter season, which will ultimately bring price gains. A key way to determine what the market is fundamentally expecting to happen with storage during the summer and what supply/demand looks like during the winter is to look at the October-to-January price spread, or the spread from the end of injection season to the peak of winter demand. A wider October-to-January spread indicates the potential that there will not be enough supply to meet demand in the winter months and incentivizes traders to put gas into storage now and take the gas out in January when prices are higher, capturing the spread. As of April 22, the October-to-January spread was sitting at $0.674/MMBtu. The last time this level of spread was seen this early in the year was 2012-2013, when the spread was $0.766/MMBtu, while 2016-2017 fell slightly lower at $0.602/MMBtu. The five-year average of this spread is $0.361/MMBtu for this time of year.
While this wide spread incentivizes traders to put gas into storage and capture the large spread later during the winter, natural gas demand will still need to be met this summer. As producers shut in wells because of poor oil economics, natural gas production will also decline, meaning less gas available for injection over the summer. Despite the expected decreased production, storage inventories will likely end up average to above average by the end of injection season. However, these inventories aren’t expected to be enough to overcome the supply drop. Continue to monitor this spread to understand what the future holds past the summer months.
See the chart below for projections of the end-of-season storage inventories as of November 1, the end of the injection season.
This Week in Fundamentals
The summary below is based on Bloomberg’s flow data and Enverus’ analysis for the week ending April 23.
Supply:
- Dry natural gas production decreased 0.69 Bcf/d on the week. The decrease mainly stems from the Mountain region (-0.41 Bcf/d) and the South Central region (-0.20 Bcf/d).
- Canadian net imports decreased 0.57 Bcf/d as imports from Canada decreased into the Northern Midcontinent and the Pacific Northwest.
Demand:
- Domestic natural gas demand decreased 4.26 Bcf/d week over week. Res/Com demand accounted for the majority of the decrease, dropping 3.40 Bcf/d on the week. Industrial and power demand also decreased, falling 0.53 Bcf/d and 0.32 Bcf/d, respectively.
- LNG exports decreased 0.41 Bcf/d on the week, while Mexican exports increased 0.16 Bcf/d.
Total supply decreased 1.26 Bcf/d, while total demand decreased 4.68 Bcf/d week over week. With the decrease in demand outpacing the decrease in supply, expect the EIA to report a stronger injection next week. The ICE Financial Weekly Index report is currently expecting an injection of 74 Bcf. Last year, the same week saw an injection of 123 Bcf; the five-year average is an injection of 79 Bcf.

